A variety of resources at your service
CCCM WEEKLY MARKET REVIEW
January 23, 2023
U.S. Markets: The major U.S. indexes finished the week mixed as recession fears appeared to weigh on sentiment. The narrowly focused Dow Jones Industrial Average performed worst and gave back a portion of its strong rally in the first two weeks of the year, while the technology-heavy Nasdaq Composite recorded a modest gain. The Dow Jones Industrial Average fell over 900 points last week to finish the week at 33,375—a decline of -2.7%. The Nasdaq finished the week up 0.6% recording its third consecutive week of gains. By market cap, the large cap S&P 500 ended the week down -0.7%, while the mid cap S&P 400 retreated -0.9% and the small cap Russell 2000 ended the week down -1%.
U.S. Economic News: The week brought several additional signals that the economy was slowing significantly following the Federal Reserve’s aggressive rate hikes in 2022. Most notable may have been Wednesday’s report of a 1.1% drop in retail sales in December, which was roughly triple consensus estimates. A drop in sales at gas stations was a major contributor, but Americans pulled back on sales of furniture, electronics, and other discretionary purchases. Receipts fell a smaller but still steep 0.7% if auto dealers and gas stations are excluded. November sales data were also revised lower. Jeffrey Roach, chief economist at LPL Financial stated, “The trajectory for the U.S. economy is weakening and recession risks are rising for 2023.”
The number of Americans filing first-time unemployment claims fell to a four-month low of just 190,000 as the U.S. labor market remains resilient. New applications fell from 205,000 in the prior week, the Labor Department reported. The last time claims were that low was in late September. Economists had forecast claims would total 215,000. Forty of the 53 states and U.S. territories that report jobless claims showed a decline last week. New York posted the biggest drop, reversing a surge in the prior week. Meanwhile, the number of people already collecting unemployment benefits rose by 17,000 to 1.65 million. While continuing claims remain low, a gradual increase since last spring suggests it’s taking longer for people who lose their jobs to find new ones.
Sales of existing homes fell for the eleventh consecutive month in December. The National Association of Realtors (NAR) reported existing-home sales fell 1.5% to a seasonally-adjusted annual rate of 4.02 million in December. The nearly yearlong monthly decline is the longest streak since the NAR began tracking sales in 1999. Economists were expecting sales to drop to 3.95 million. The level of sales activity was lowest since November 2010, in the midst of the foreclosure crisis in America. Compared with the same time last year, home sales were down 34%. The median price for an existing home fell to $366,900 in December, from $370,700 in November.
In the New York region, a gauge that measures manufacturing activity dropped sharply in January signaling a deep contraction in activity. The New York Fed reported its Empire State Business Conditions index tumbled 21.7 points to -32.9 at the start of the year—its lowest level since the worst of the pandemic in May of 2020. Economists had expected a reading of just -7. The new orders index, an indicator of future activity, fell 27.5 points to negative 31.1 in January. Shipments fell 27.7 points to negative 22.4. The indexes for prices paid and prices received moved lower as well. Following the report, Gurleen Chadha, economist at Oxford Economics wrote in a note, “Manufacturing conditions in the U.S. are deteriorating and the worst is likely ahead.”
The “Beige Book”, a collection of anecdotal reports from each of the Federal Reserve’s member banks around the country, reported businesses expect ‘little growth in the months ahead’. Overall, economic activity in most of the 12 Fed districts over the past six weeks showed either slight increases or slight declines of activity. Only one regional bank--the New York Fed--reported a significant decline in activity. The labor market was a bright spot, with all but a few districts reporting that job growth continued. Firms still reported having difficulty filling open positions. Many firms were hesitant to lay off employees, reporting they planned to reduce headcount through attrition if needed. On the inflation front, selling prices increased at a moderate pace in most districts although many said the pace of increases had slowed from recent months.
rates in the world.
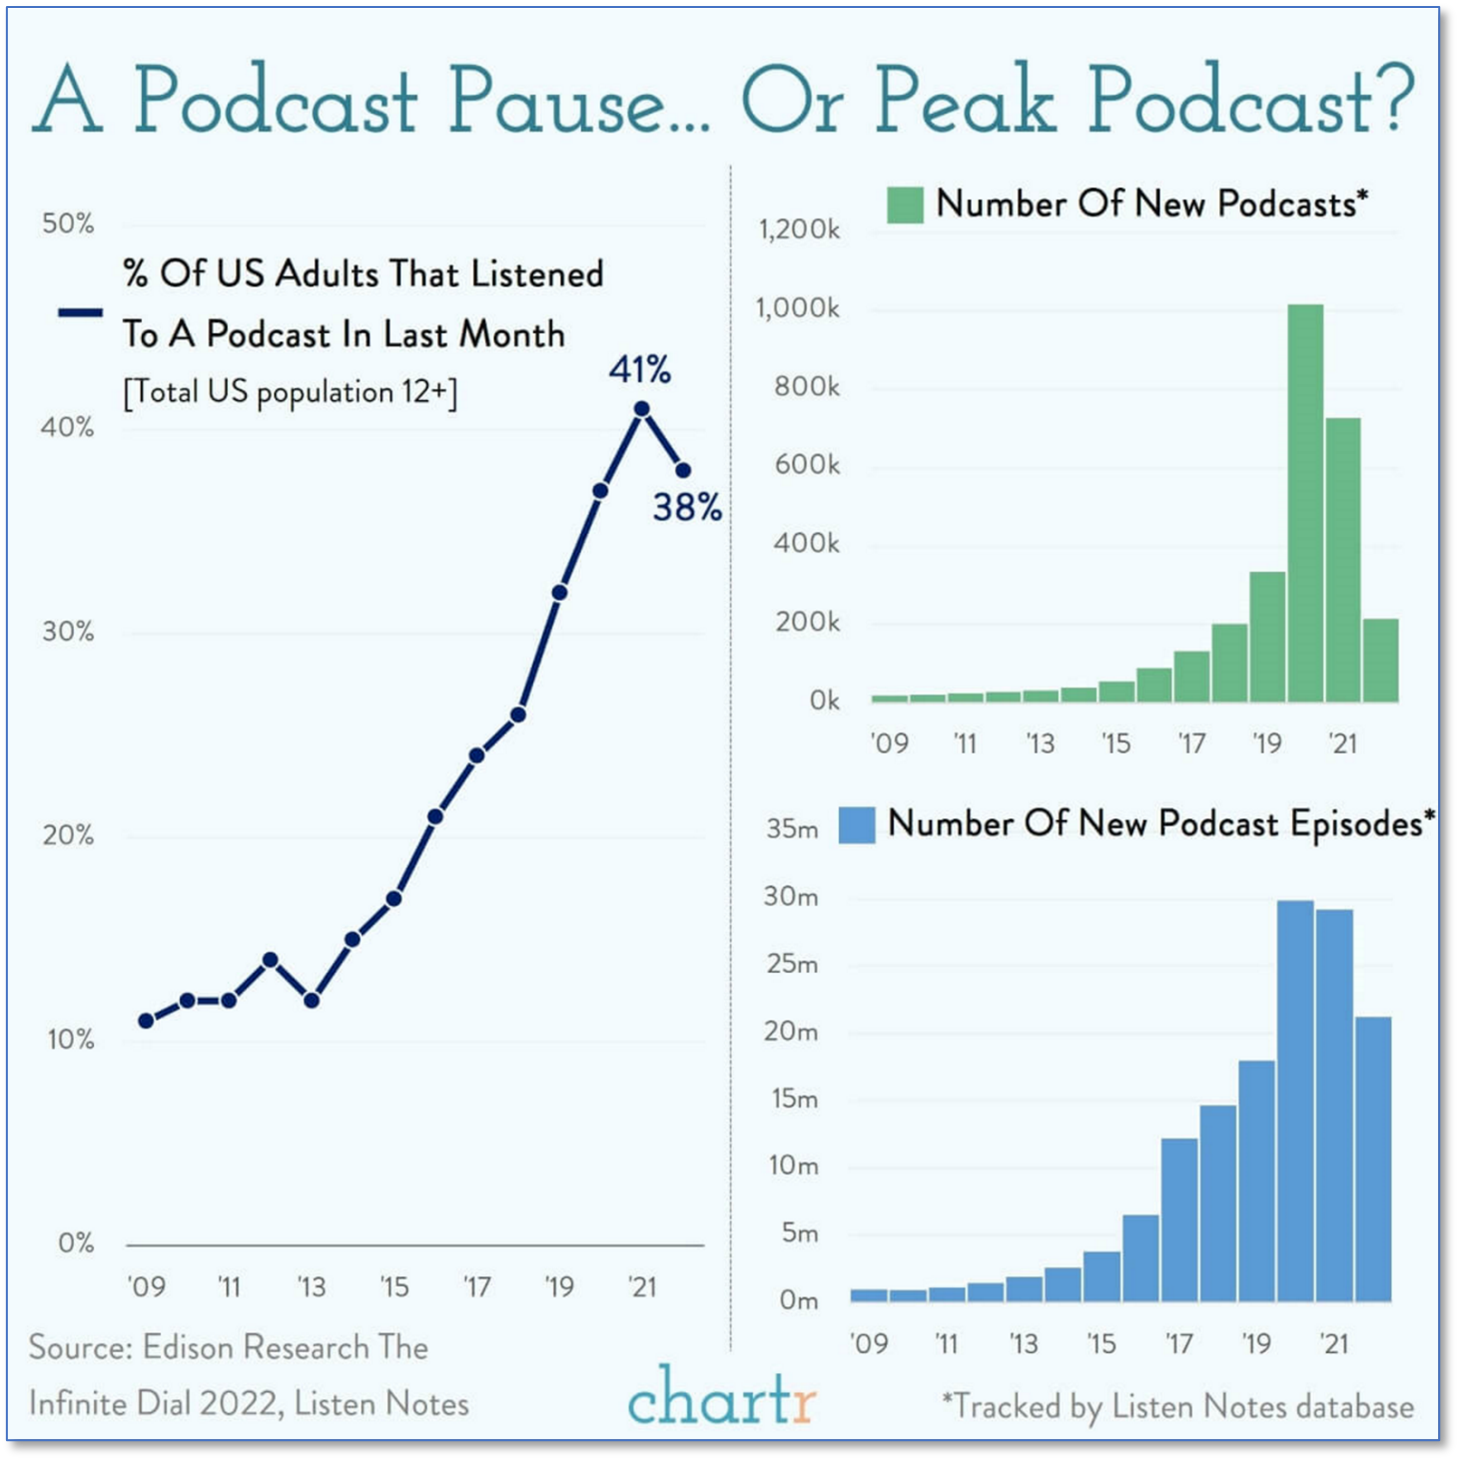
Finally: It may be time to add podcasts to the list of trends that peaked in 2020 and are now returning to Earth. A multitude of media empires were created by podcasters such as Joe Rogan as audio giants like Spotify poured money into the industry. However, data from Edison Research shows the boom may be over. After years of growth, listener numbers fell last year after just 38% of adults surveyed said they had listened to a podcast in the last month. Furthermore, Listen Notes, a podcast database, confirmed over 1 million new podcasts were launched in 2020. Last year, however, that same database tracked just 217,000 new shows—an 80% drop. (Chart from chartr.co)
The Dow Jones Industrial Average (DJIA), commonly known as “The Dow” is an index representing 30 stocks of companies maintained and reviewed by the editors of the Wall Street Journal. The S&P 500 is an unmanaged index of 500 widely held stocks that is generally considered representative of the U.S. stock market. The S&P Mid Cap 400® provides investors with a benchmark for mid-sized companies. The index, which is distinct from the large-cap S&P 500®, measures the performance of mid-sized companies, reflecting the distinctive risk and return characteristics of this market segment. The NASDAQ composite is an unmanaged index of securities traded on the NASDAQ system The Russell 2000 Index measures the performance of the 2,000 smallest companies in the Russell 3000 Index, which represent approximately 8% of the total market capitalization of the Russell 3000 Index The Purchasing Managers' Index (PMI) is an indicator of the economic health of the manufacturing sector. The PMI is based on five major indicators: new orders, inventory levels, production, supplier deliveries and the employment environment. One cannot invest directly in an index. Past Performance does not guarantee future results. Investing in commodities is generally considered speculative because of the significant potential for investment loss. Their markets are likely to be volatile and there may be sharp price fluctuations even during periods when prices overall are rising. Gold is subject to the special risks associated with investing in precious metals, including but not limited to: price may be subject to wide fluctuation; the market is relatively limited; the sources are concentrated in countries that have the potential for instability; and the market is unregulated. Sector investments are companies engaged in business related to a specific sector. They are subject to fierce competition and their products and services may be subject to rapid obsolescence. There are additional risks associated with investing in an individual sector, including limited diversification.
This newsletter was created by Sherman Letter an unaffiliated third party. Any opinions are those of the author and not necessarily those of Raymond James. The foregoing information has been obtained from sources considered to be reliable, but we do not guarantee that it is accurate or complete, it is not a statement of all available data necessary for making an investment decision, and it does not constitute a recommendation.
January 17, 2023
U.S. Markets: U.S. stocks recorded a second consecutive week of gains as investors weighed key inflation data and the start of the quarterly earnings reporting season. The NASDAQ Composite and growth-oriented sectors outperformed, helped by rebounds in some mega-cap technology names including Amazon, Tesla, and Microsoft. The Dow Jones Industrial Average rose 2.0% last week, finishing the week at 34,303. The technology-heavy NASDAQ Composite made up some lost ground by rallying 4.8%. By market cap, the large cap S&P 500 added 2.7%, the mid cap S&P 400 gained 3.7% and the small cap Russell 2000 fared the best rallying 5.3%.
U.S. Economic News: The number of Americans filing first-time unemployment benefits ticked down slightly as the U.S. labor market remains relatively tight. The Labor Department reported initial jobless claims fell by a seasonally-adjusted 1,000 to 205,000 in the week ended January 7th. Economists had expected claims to rise by 6,000 to 210,000. Initial claims remain near historic lows not seen since the late 1960’s. Meanwhile, the number of people already collecting benefits, known as “continuing claims”, fell by 63,000 to 1.63 million.
The cost of living ticked down last month, posting its first decline since the onset of the coronavirus pandemic in 2020. The Labor Department reported the Consumer Price Index for December fell 0.1% in December, matching economists’ expectations. Furthermore, the annual rate of inflation fell for the sixth month in a row to 6.5% from 7.1%. That’s the lowest level in more than a year and down from its 40-year peak of 9.1% last summer. The core rate of inflation, which omits food and energy prices, rose 0.3% to an annualized 5.7% increase, also matching forecasts. The Federal Reserve views the core rate as a more accurate measure of future inflation trends. Charlie Ripley, senior investment strategist at Allianz Investment Management noted the latest report supports the Federal Reserve’s goal of a ‘soft-landing’ may be attainable after all. “Today’s inflation print is another sign that the Fed’s prescription for bringing down high inflation is working,” he wrote. Sam Bullard, senior economist at Wells Fargo was a bit more cautious writing, “Inflation is moving in the right direction, but I am not sure it offers crystal clear evidence on what the Fed will do in February.”
Confidence among the nation’s small business owners fell to a six-month low in December as sales and business conditions worsened at year-end. The National Federation of Independent Business reported its small-business optimism index fell 2.1 points to 89.8 in December. Economists had expected a slight increase to 92.0. NFIB Chief Economist Bill Dunkelberg said, “Small business owners are not optimistic about 2023 as sales and business conditions are expected to deteriorate.” The survey showed the deterioration in confidence was driven by declining earnings trends due to rising costs of materials and weaker sales. Furthermore, small-business owners still report difficulty finding skilled workers—41% of owners reported job openings that remained unfilled.
Sentiment among the nation’s consumers jumped to a 9-month high given the slowing of inflation and the rebound in equity markets. The University of Michigan reported its preliminary reading of consumer sentiment rose 5 points to 64.7 in January reflecting easing worries about inflation and Americans’ greater confidence in their personal finances. Overall, however, sentiment remains well off its pre-pandemic high of 101. In the details, the gauge that measures what consumers think about their personal financial situation and the current health of the economy climbed to 68.6 last month. Another measure that asks about expectations for the next six months moved up to 62 from 59.9 in the prior month. Overall, Americans viewed inflation as a lessening threat. They expect the inflation rate in the next year to average about 4%, down from 4.4% in the prior month.
Consumers’ expectations of inflation in the short-term continued to decline according to the latest report from the New York Federal Reserve. The regional bank said its December Survey of Consumer Expectations showed inflation running at a 5% rate a year from now. That’s down from 5.2% in November, and its lowest level since July of 2021. Over a longer timeframe of three years, consumers see inflation running at a 3% rate—unchanged from November. Of note, consumer expectations about income growth rose by 0.1% to 4.6%, a new high for the series. The Federal Reserve monitors public perceptions of inflation as future inflation trends tend to mirror expectations.
The Federal Reserve reported total consumer credit rose by $28 billion in November, up 7.1% from the same time last year, as consumers used credit cards amid the worst inflation in forty years. The reading was down slightly from October’s $29.1 billion gain and annual rate of 7.4%, but higher than the consensus forecast of a $26 billion gains. In the report, revolving credit, such as credit cards, rose 16.9% in November up 6.6% from October, while nonrevolving credit, typically auto and student loans, rose 3.9%--down from 6.5% in the prior month. Consumer credit has been growing consistently between $24 billion and $30 billion per month for the past seven months. Nancy Van Houten, economist at Oxford Economics wrote in a note, “The data suggest that consumers are relying more on borrowing to finance consumption in the face of high inflation and dwindling savings.”
In a pair of speeches, Philadelphia Fed President Patrick Harker and St. Louis Fed President gave similar messages regarding the path the Federal Reserve should take to tame inflation. In a speech to the Main Line Chamber of Commerce in Philadelphia, Harker stated the Federal Reserve should raise its benchmark interest rate slightly above 5% and then pause. “I expect that we will raise rates a few more times this year, though, to my mind, the days of us raising them 75 basis points at a time have surely passed. In my view, hikes of 25 basis points will be appropriate going forward,” Harker said. In St. Louis, Fed President James Bullard stated the Federal Reserve’s policy of “front-loading” interest-rate hikes last year was a success and should be continued. Getting interest rates above 5% is needed to put downward pressure on inflation, Bullard said, in a streamed discussion with bankers from several Midwestern states. The Fed raised its benchmark rate by 50 basis points in December to a range of 4.25%-4.5%. The Fed has penciled in 75 basis points of additional rate hikes in 2023.
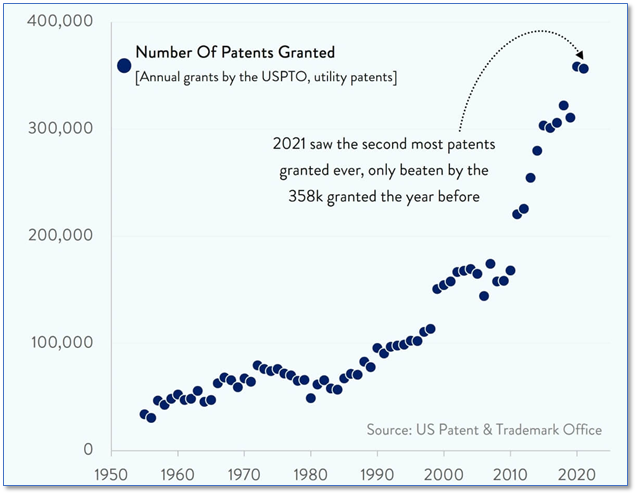
Finally: The Consumer Electronics Show (CES), the world's largest technology trade show, offers a glimpse into products coming down the pipeline. This year, the ever-expanding field of products showcased everything from color-changing cars to an oven that prevents food from burning. As one would expect, most of the innovative technologies on display at CES are covered by patents, and digging through patent filings is a popular way of picking up on future tech trends. Filings mentioning "metaverse", for example, have risen significantly, as have those mentioning "foldable technology", "electric vehicles" and "sustainable technology". In the latest data from the U.S. Patent and Trademark Office, 2020 and 2021 saw the most patents granted ever—with over 350,000 new patents being granted each of those years. (Chart from chartr.co)
(Sources: All index- and returns-data from Yahoo Finance; news from Reuters, Barron’s, Wall St. Journal, Bloomberg.com, ft.com, guggenheimpartners.com, zerohedge.com, ritholtz.com, markit.com, financialpost.com, Eurostat, Statistics Canada, Yahoo! Finance, stocksandnews.com, marketwatch.com, wantchinatimes.com, BBC, 361capital.com, pensionpartners.com, cnbc.com, FactSet.)
The Dow Jones Industrial Average (DJIA), commonly known as “The Dow” is an index representing 30 stocks of companies maintained and reviewed by the editors of the Wall Street Journal. The S&P 500 is an unmanaged index of 500 widely held stocks that is generally considered representative of the U.S. stock market. The S&P Mid Cap 400® provides investors with a benchmark for mid-sized companies. The index, which is distinct from the large-cap S&P 500®, measures the performance of mid-sized companies, reflecting the distinctive risk and return characteristics of this market segment. The NASDAQ composite is an unmanaged index of securities traded on the NASDAQ system The Russell 2000 Index measures the performance of the 2,000 smallest companies in the Russell 3000 Index, which represent approximately 8% of the total market capitalization of the Russell 3000 Index The Purchasing Managers' Index (PMI) is an indicator of the economic health of the manufacturing sector. The PMI is based on five major indicators: new orders, inventory levels, production, supplier deliveries and the employment environment. One cannot invest directly in an index. Past Performance does not guarantee future results. Investing in commodities is generally considered speculative because of the significant potential for investment loss. Their markets are likely to be volatile and there may be sharp price fluctuations even during periods when prices overall are rising. Gold is subject to the special risks associated with investing in precious metals, including but not limited to: price may be subject to wide fluctuation; the market is relatively limited; the sources are concentrated in countries that have the potential for instability; and the market is unregulated. Sector investments are companies engaged in business related to a specific sector. They are subject to fierce competition and their products and services may be subject to rapid obsolescence. There are additional risks associated with investing in an individual sector, including limited diversification
This newsletter was created by Sherman Letter an unaffiliated third party. Any opinions are those of the author and not necessarily those of Raymond James. The foregoing information has been obtained from sources considered to be reliable, but we do not guarantee that it is accurate or complete, it is not a statement of all available data necessary for making an investment decision, and it does not constitute a recommendation.
In the ever-changing landscape of finance we must ensure our clients are properly invested based upon their investment goals and objectives.
Peter Chapman
Links are being provided for information purposes only. Raymond James is not affiliated with and does not endorse, authorize or sponsor any of the listed websites or their respective sponsors. Raymond James is not responsible for the content of any website or the collection or use of information regarding any website's users and/or members.
Securities offered through Raymond James Financial Services, Inc. Member FINRA / SIPC. Investment advisory services offered through Raymond James Financial Services Advisors, Inc. Chapman & Cardwell Capital Management is not a registered broker/dealer, nor is it affiliated with Raymond James Financial Services.
Raymond James financial advisors may only conduct business with residents of the states and/or jurisdictions for which they are properly registered. Therefore, a response to a request for information may be delayed. Please note that not all of the investments and services mentioned are available in every state. Investors outside of the United States are subject to securities and tax regulations within their applicable jurisdictions that are not addressed on this site. Contact your local Raymond James office for information and availability. Links are being provided for informational purposes only. Raymond James is not affiliated with and does not endorse, authorize or sponsor any of the listed websites or their respective sponsors. Raymond James is not responsible for the content of any website or the collection or use of information regarding any website’s users and/or members. | Legal Disclosures | Privacy Policy
© Chapman & Cardwell Capital Management. All Rights Reserved.